












Thin Spread
PwC pulled together a breakdown of Cornerstone's current revenue mix alongside a peer benchmarking analysis. The CFO is curious how the bank compares to peers on fee income. Take a look at Exhibit 1 and tell me what you see.
Case Exhibit
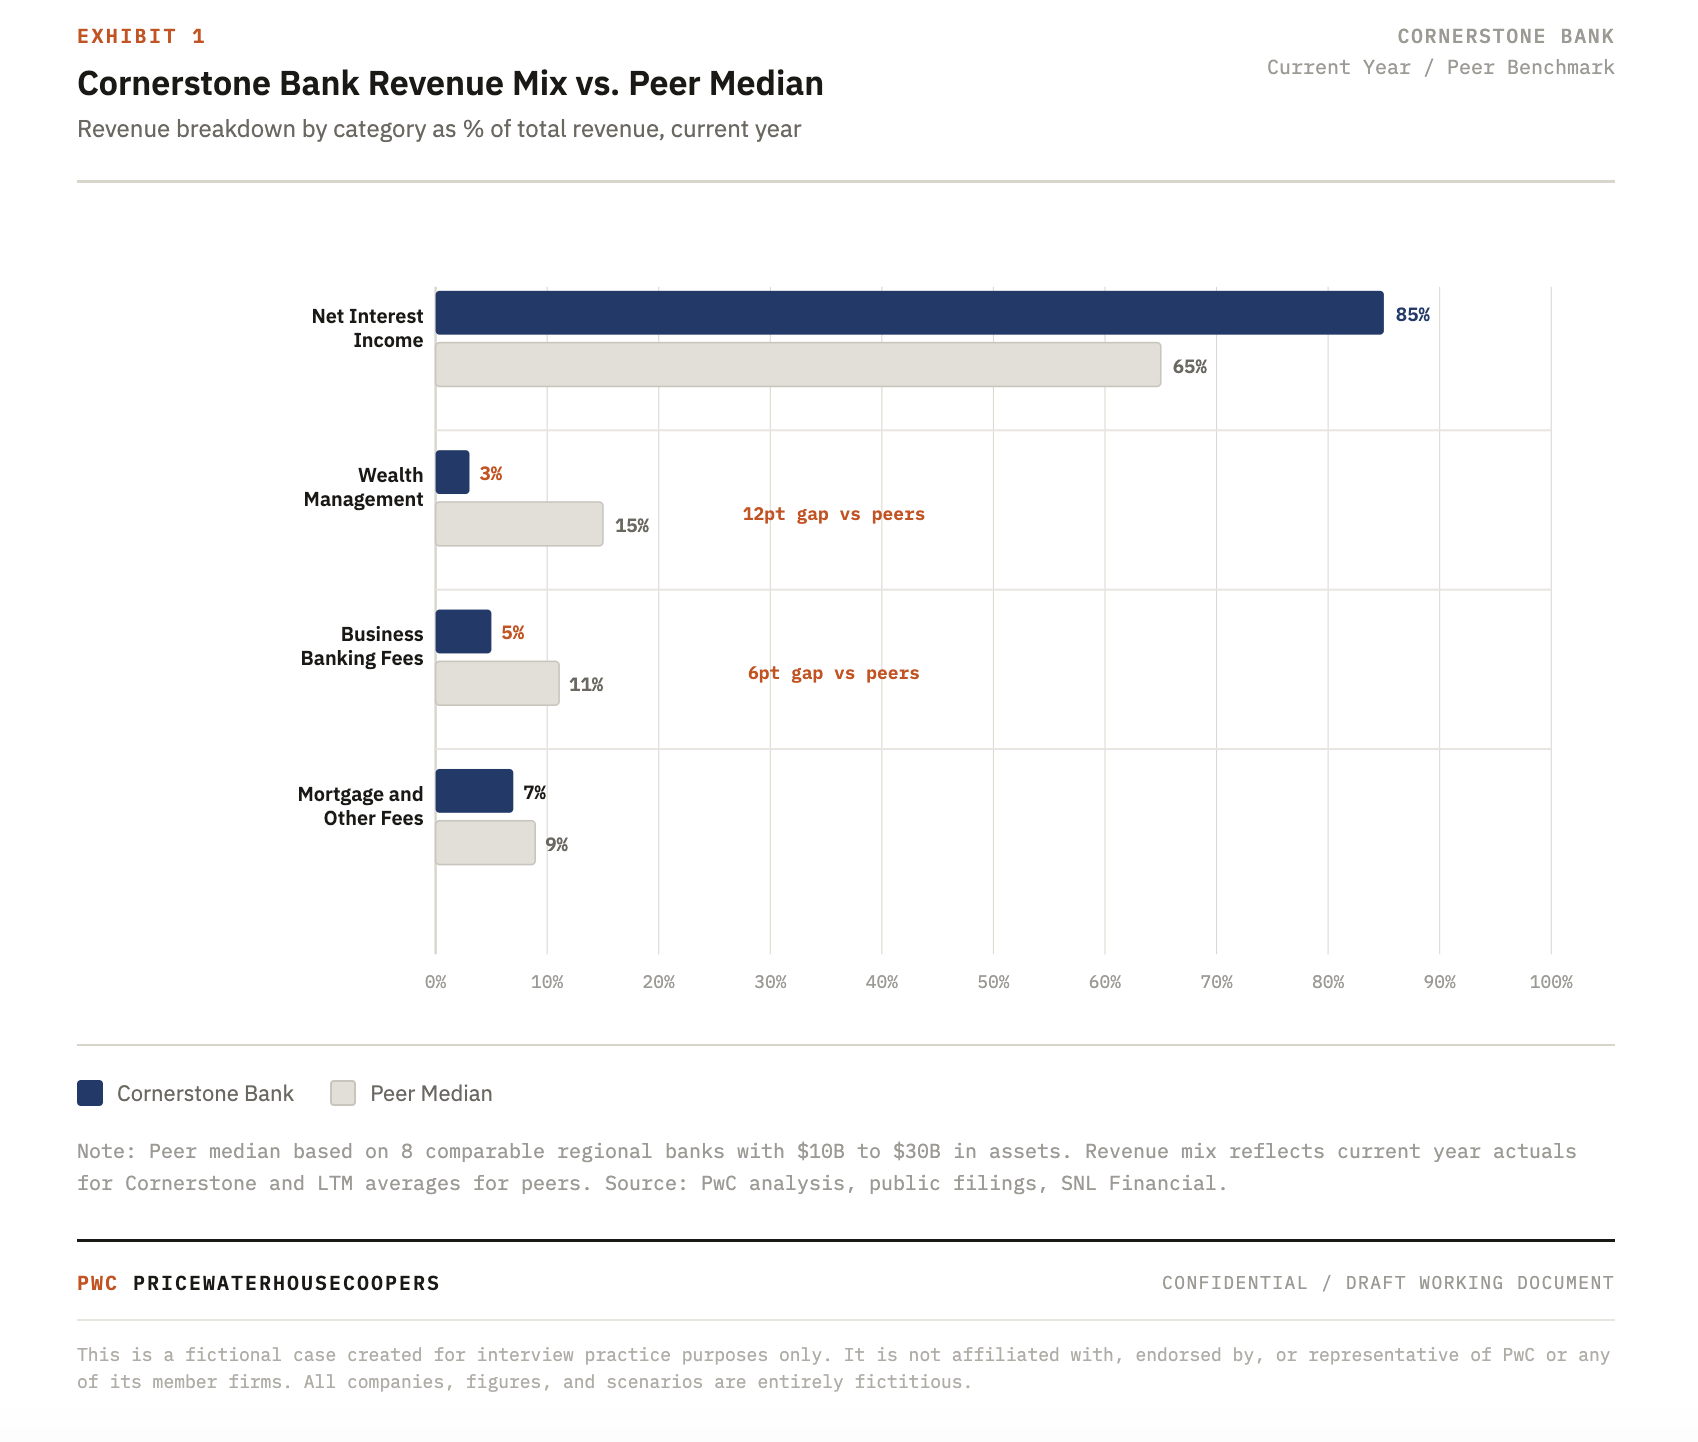
The exhibit makes two things clear. First, Cornerstone is significantly more reliant on net interest income than its peer group, with roughly 85% of revenue coming from interest income compared to a peer median of around 65%. Second, the gap is almost entirely explained by underperformance in two fee income categories: wealth management and service charges and fees on business banking accounts.
Wealth management is the more striking gap. Peers generate roughly 15% of revenue from wealth management and advisory fees, while Cornerstone generates less than 3%. Given the bank's existing retail customer base across 12 states, this is a significant missed opportunity. The customer relationships are already there. The question is whether Cornerstone has the product capability to serve them or whether it needs to build or buy that capability.
The business banking fee gap is smaller but also meaningful. Cornerstone appears to be leaving money on the table on products it likely already offers, suggesting a pricing or cross-sell execution problem rather than a capability gap.
The strategic implication is clear: wealth management is the highest-priority growth vector, followed by improving business banking fee capture. Both are achievable without entering entirely new markets.